


OPINION:
Does China have a larger economy than the U.S.? Is India, Germany or Japan the world’s third-largest economic power? How many minutes of labor does it take for the average worker to buy a Big Mac? These may seem like simple and straightforward questions, but the answers are surprisingly complex. Organizations such as the International Monetary Fund, the World Bank, the United Nations and others also have large research staffs searching for better ways to measure the world economy.
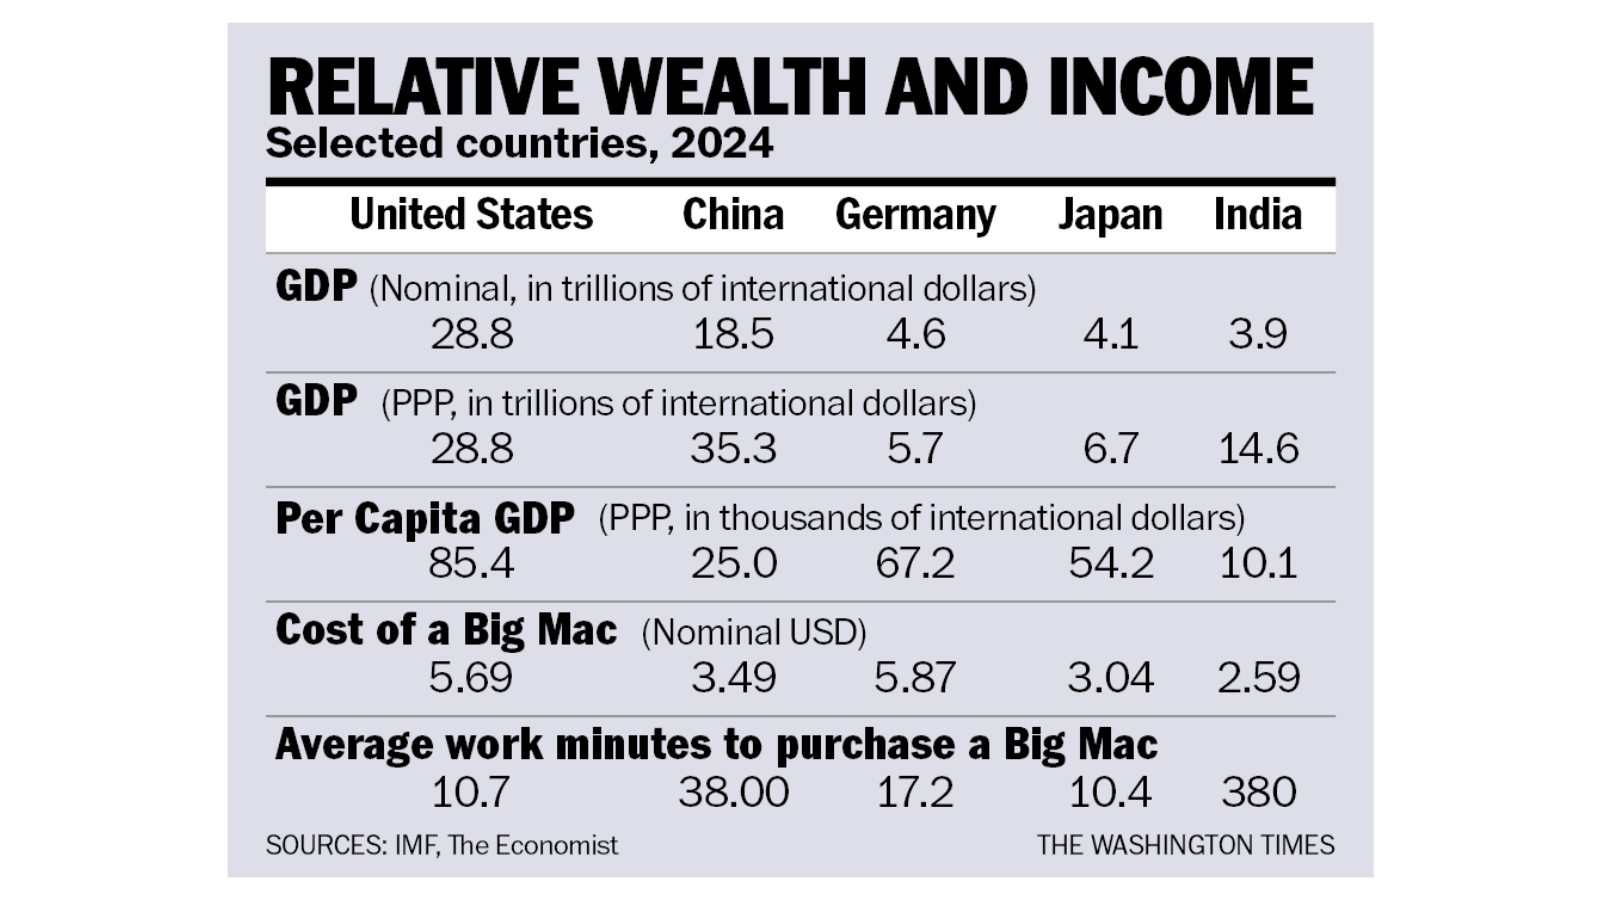
The accompanying table was derived from recent reports from the IMF and The Economist. The IMF, like other organizations, uses several methods to calculate the relative size of economies. What is jarring is that the U.S. economy is either about 40% larger than China’s or about 20% smaller, depending on the methodology used.
Per capita income, typically calculated as the gross national income or gross domestic product divided by the population, is intended to provide a snapshot of the average individual economic well-being in a given country. But price levels, including what are considered necessities, vary greatly from country to country, depending on what things are domestically sourced (oranges are relatively less expensive in Brazil than in Norway) and how efficient distribution channels are. Countries with Walmart Supercenters often provide consumers with greater choice (both in price and quality) than countries with less efficient stores.
Currency conversion and exchange rates significantly affect the comparability of per capita income across countries. Nominal exchange rates can fluctuate widely because of market forces, political decisions that affect economic policy, and external events like wars and acts of nature — floods, droughts, volcanic eruptions, earthquakes, etc. — all of which can cause substantial distortions in income comparisons.
To neutralize some of these problems, economists use purchasing power parity, known as PPP, to adjust for differences in price between countries. PPP attempts to equalize the purchasing power of different currencies by accounting for the relative cost of a standard set of goods and services. Making such calculations presents difficulties, such as variations in consumption patterns and the availability of goods across different countries.
Differences in the cost of living skew per capita income comparisons. For example, a higher nominal per capita income in a densely populated urban country (like England) might be offset by higher housing costs. In contrast, a lower nominal per capita income in a less densely populated country (such as Spain) might suffice for a relatively comfortable living standard because necessities cost less there. Among U.S. states, New Yorkers typically have higher per capita incomes than those who live in Tennessee. Still, housing, transportation costs, taxes, etc., are much lower in Tennessee, causing an exodus of people from New York to Tennessee to enjoy a higher real standard of living.
Many countries lack the statistical infrastructure needed to collect and report accurate and reliable economic data. Countries with extensive informal sectors that are not fully captured in official GDP calculations often underestimate real per capita income. Several decades ago, I participated in an economic policy conference in Italy. The Italian finance minister at the time quipped that when making policy decisions, he assumed that the Italian economy was 40% larger than the official numbers.
Per capita income is an average measure and does not account for income inequality. A poor country, in which a significant portion of the population relies on basic agriculture and barter, appears to have almost no income, while those who have migrated to the cities and developed a variety of skill sets are relatively well off. Averaging the income of those in the barter economy with that of those in the developed money economy is almost meaningless information.
The editors of The Economist invented the Big Mac index in 1986 as an informal way of measuring PPP between countries. It may have started as a whimsy, but it is very useful because the Big Mac is a standardized product sold almost everywhere in the world.
When combined with the number of minutes a typical worker needs to work to buy a Big Mac, it indicates relative well-being. It takes a little more than 10 minutes of work to buy one Big Mac in the U.S. or Japan and 17 minutes in Germany. By this measure, the typical Japanese person is a bit richer than the average German, while the IMF numbers show just the opposite. By any measure, the Chinese are much poorer than the typical American, German or Japanese person, but the income disparity is not as great if income is measured by the ability to buy Big Macs.
Finally, there is India — poor by any of the measures — where few buy Big Macs because most are vegetarians and cannot afford them. Indexes of relative well-being can be useful for those who understand the limitations, including the imprecision of the data.
• Richard W. Rahn is chairman of the Institute for Global Economic Growth and MCon LLC.
Please read our comment policy before commenting.